In production
Your own numbers, on every render.
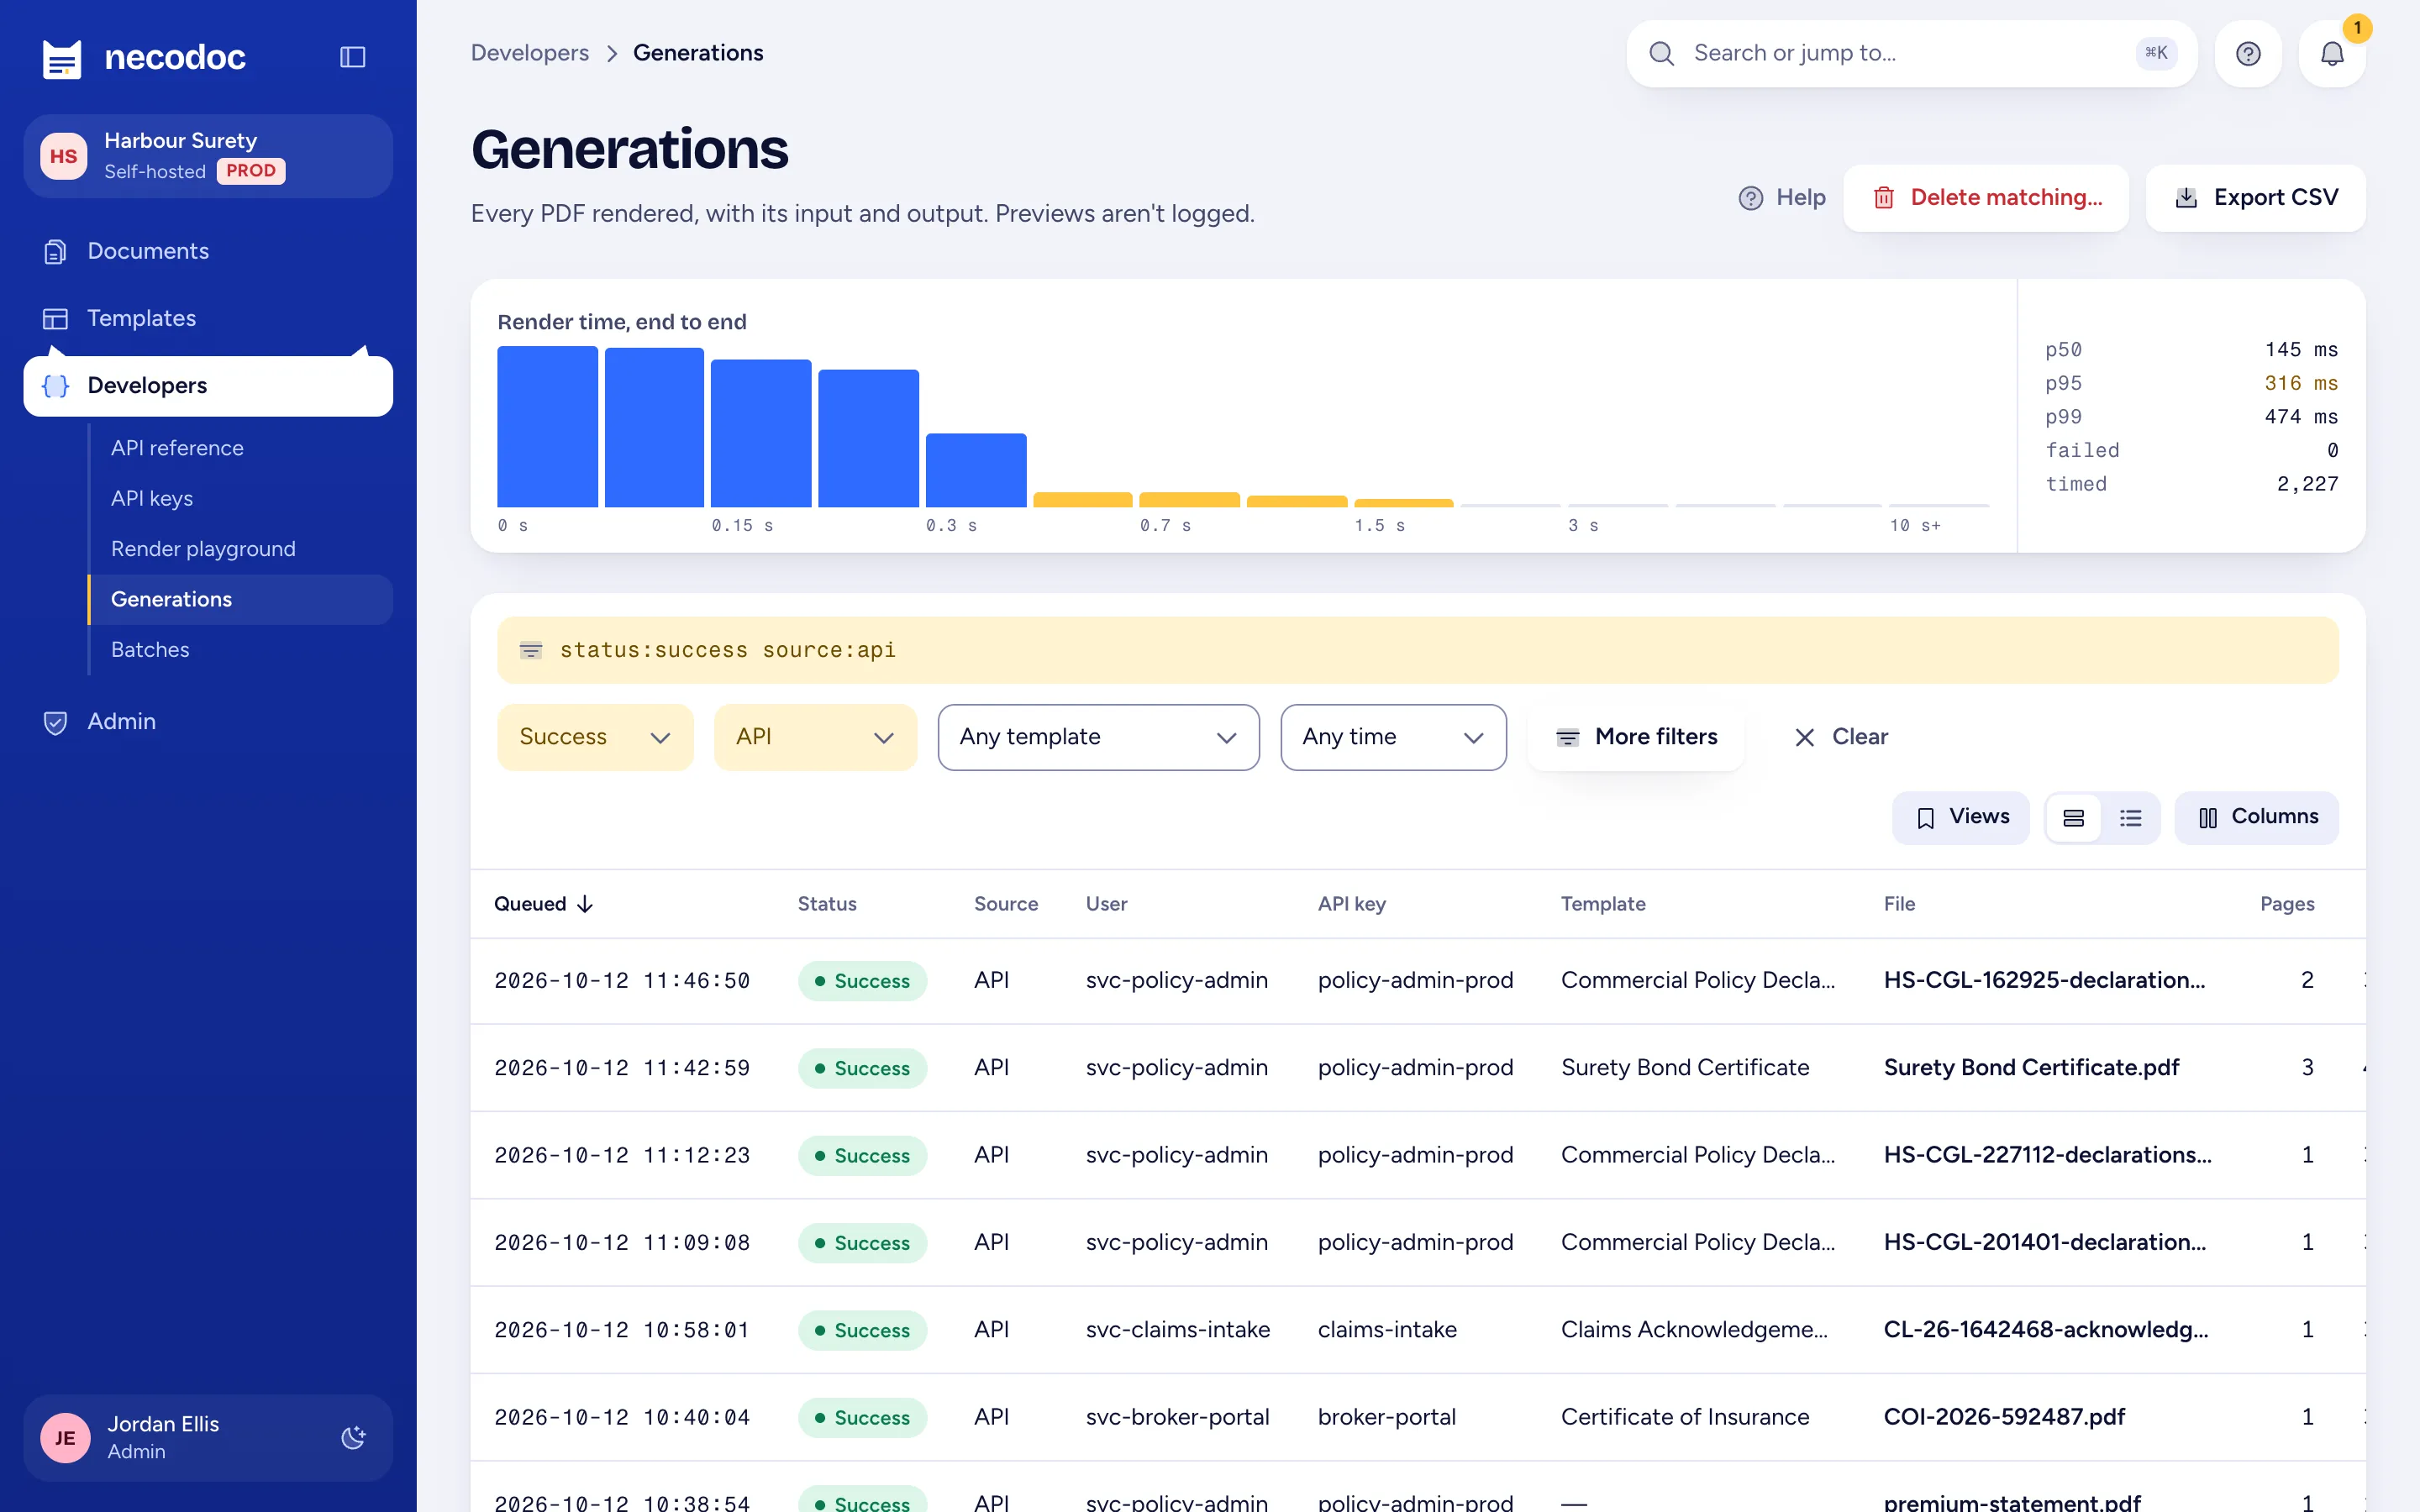
In production, the generation log records the queue wait, run time and a per-step breakdown for every PDF. Admin › System shows p50, p95 and p99 over a window you select.
ProofGeneration log
necodoc / Performance
Performance
Every performance figure on this site comes from pnpm bench, which starts a throwaway necodoc stack and
measures it through the public API. The machine, date and commit sit next to every number.
Latency
| Scenario | Pages | p50 | p95 | p99 | n |
|---|---|---|---|---|---|
| HTML to PDF, 1 page | 1 | 15 ms | 18 ms | 20 ms | 100 |
| HTML to PDF, invoice with header/footer | 3 | 30 ms | 35 ms | 45 ms | 100 |
| Designed template, surety bond | 2 | 21 ms | 25 ms | 30 ms | 100 |
| Overlay, AcroForm bond (Phoenix AZ) | 1 | 28 ms | 32 ms | 36 ms | 100 |
| Overlay, flat bond (Rockville MD) | 3 | 28 ms | 30 ms | 38 ms | 100 |
Throughput
| Workers | Docs/min |
|---|---|
| 1 | 5,950 |
| 2 | 11,300 |
| 4 | 22,010 |
| 8 | 43,430 |
Cold start and archival
In production
In production, the generation log records the queue wait, run time and a per-step breakdown for every PDF. Admin › System shows p50, p95 and p99 over a window you select.
Postgres on the same machine with default settings, local disk storage, calls over loopback. No network, S3 or Azure round trips, TLS or proxy.
Render time grows with pages, images, fonts and table size. The test set is typical insurance documents. It isn't a worst case.
Each run is timed from the batch's creation to its last row, so it includes the time a job waits for a worker slot. RENDER_CONCURRENCY sets the slots per worker.
It measures the first job on a new worker. A worker starts Chromium and opens its pages before it takes jobs. It doesn't measure a container or node cold start.
One request at a time. It says nothing about latency under concurrent load.
| CPU | Apple M5, 10 cores |
| Memory | 32 GB |
| OS | macOS 27.0 |
| Node | v24.21.0 |
| Chromium | 151.0.7922.34 |
| Postgres | PostgreSQL 18.6 (Homebrew) |
| Storage | disk (local temp directory) |
| Commit | b359f12 |
| Load average before | 4.69 / 5.16 / 5.99 |
Rerun it
The benchmark creates its own database and starts its own processes. It removes both when it ends, even after a failure, and never touches another necodoc install.
# once: the Chromium build the API pins
pnpm --filter @necodoc/api chromium:install

# the full run (under fifteen minutes on a laptop)
pnpm bench

# samples, batch rows, worker counts, concurrency
pnpm bench --help